If you have WordPress or any other PHP site hosted on IIS you can debug it for free. No Apache server is required. You can use NetBeans with Xdebug.
This article records all the steps required to debug a PHP site on IIS. It seems that actual WEB server used is irrelevant. However, all steps here were tested on Windows 7 SP1 with IIS 7.5.
(01) Download JAVA and IDE (Integrated Develop / Design Environment) This is analogous to MS Visual Studio (VS). Oracle offers a combo pack – JAVA SDK + NetBeans. You need both. Search for “JDK 6 Update 24 with NetBeans 6.9.1”.
http://www.oracle.com/technetwork/java/javase/downloads/jdk-netbeans-jsp-142931.html
(02) From Xdebug download “Xdebug Extension for PHP”. This is a layer between WEB server and IDE to communicate.
Go directly to http://www.xdebug.org/find-binary.php and it will amazingly help you to pick the right download file for your specific configuration. Wizard will also tell you the steps required for your particular combination of OS and Web Server.
This is a single DLL file that you’ll need to place into your PHP EXT directory (Example: C:\PHP\. You also instructed to edit your php.ini file (see Step03).
(03) There is one additional step that is required. Add these lines to the end of your php.ini file:
[zend]
 zend_extension = "…your path..\ext\php_xdebug-2.1.0-5.3-vc9-nts.dll"
 xdebug.remote_enable=On
 xdebug.remote_host=localhost     <==  Without Quotes - Thanks to our reader Oleg
 xdebug.remote_port=9000
 xdebug.remote_handler="dbgp"
Above are 5 congif lines. First line is from a previous step. Remember to restart your WEB server.
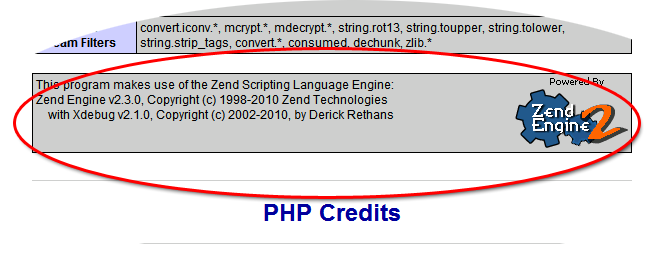
(04) Test if your Xbedug is loaded. Run your phpinfo page. You should see Zend Engine logo immediately before PHP Credit section:

(05) Start NetBeans, and go to
– File –> New Project –> PHP –> PHP Application with Existing Sources and click next.
– Navigate to your PHP site and give it a distinct name. Check the box to put meta-data in a local directory and click Next.
– Make final selections on a last screen and click Finish.
More elaborate instructions for debugging WordPress on Apache server are provided here
http://wiki.netbeans.org/ConfiguringNetBeansProjectForWordPress
and they also seem to work for IIS.
(06) To start debug click on menu Debug –> Debug Main Project (Ctrl+F5).
Note that NetBeans will stop at the very first line in your index.php file, which is unusual for VS people. Debug operations and buttons are very similar to VS.
I will update this article, if I find how to use a conditional break-point. Good luck!
Debug on a Remote Server |
[ 2013-02-22 FR 18:25] |
[This section is a work in progress – These steps an not verified yet]
If you need to debug on a remote server, here are the steps:
| Actions on your remote server | Actions on PC, where NetBeans is installed | |
|---|---|---|
| Install XBEBUG – copy one DLL into PHP ext directory | Open port 9000 – Yes! Open TCPIP port 9000 on this machine. This machine will be listening for a connection from your server. | |
| Add these lines to your php.ini: | ||
| [zend] zend_extension = “…your path..\ext\php_xdebug-2.1.0-5.3-vc9-nts.dll” xdebug.remote_enable=On xdebug.remote_host=192.168.0.XXX xdebug.remote_port=9000 xdebug.remote_handler=”dbgp” |
||
| 192.168.0.XXX referes to a PC where NetBeans is istalled | Start a browser session and add this parameter to the URL: XDEBUG_SESSION_START=session_name |
|
| Example: http://localhost:80/YourSiteDirectory/index.php?XDEBUG_SESSION_START=netbeans-xdebug |
to a remote server, open port 9000 on machine where NetBeans is installed


Thanks a lot. Life saver article!!!
php.ini settings values must be set without quotes ( except the path to the zend extension):
xdebug.remote_enable=On
xdebug.remote_host=localhost
xdebug.remote_port=9000
xdebug.remote_handler=dbgp
If you use values in quotes, NetBeans cannot find XDebug and shows a message box in which advises to set values exactly as I’ve said i.e. without quotes
woot! it works.
i was getting worried because so many of the top links on this issue addressed apache only.